
So, I have done quite many expert evaluations throughout the years. It’s time efficient and cost effective. If you don’t know what it is, it’s an evaluation method where you act as an expert, and you can use different frameworks, but I guess the most famous one is the 10 heuristics created by Jacob Nilsen. You go through the feature/product/service and go through the heuristics to see if they are fulfilled. It is way faster than usability testing (you should probably do both, but still) and most definitely less expensive. But sometimes it feels a little detached from reality. Just like staring at a Google Analytics funnel can feel. It tells you what the users are doing but not really why they are doing it, and what one can do to prevent a drop off in one of the sections in the funnel. So what happens if you combine these two?
I think looking at quantitative data for indication on where to dig deeper in usability testing is really good to be efficient when recruiting and planning for usability testing, because going wide can be really tricky. And it is also quite a hassle to go from insight to solution, and to prioritise the solution in to the developers team backlog and so on, and how do you actually prioritise? because most of the time you can’t have it all.
So, the method can give you:
1. An indication on where your focus should be while doing usability testing
2. Pin pointing out how you could reduce drop off in a flow
3. Help you prioritise it, how much resources it would take and what sort of value it would bring to the end user. With the help of hypothesis and Scoring
4. It will give you both a little qualitative results based on user centric quantitative data
So what do you need?
1. You need a flow with a legit Google Analytics funnel (those are nice)
2. You need to choose an Expert evaluation checklist
3. You need to choose a scoring method, might be ICE (Impact, Confidence and ease. And a Hypothesis framework.
Step number 1
Invite people who are interested and have knowledge around the product. You probably need around 2h for the workshop depending on how long the flow is you’re investigating.
Preparation
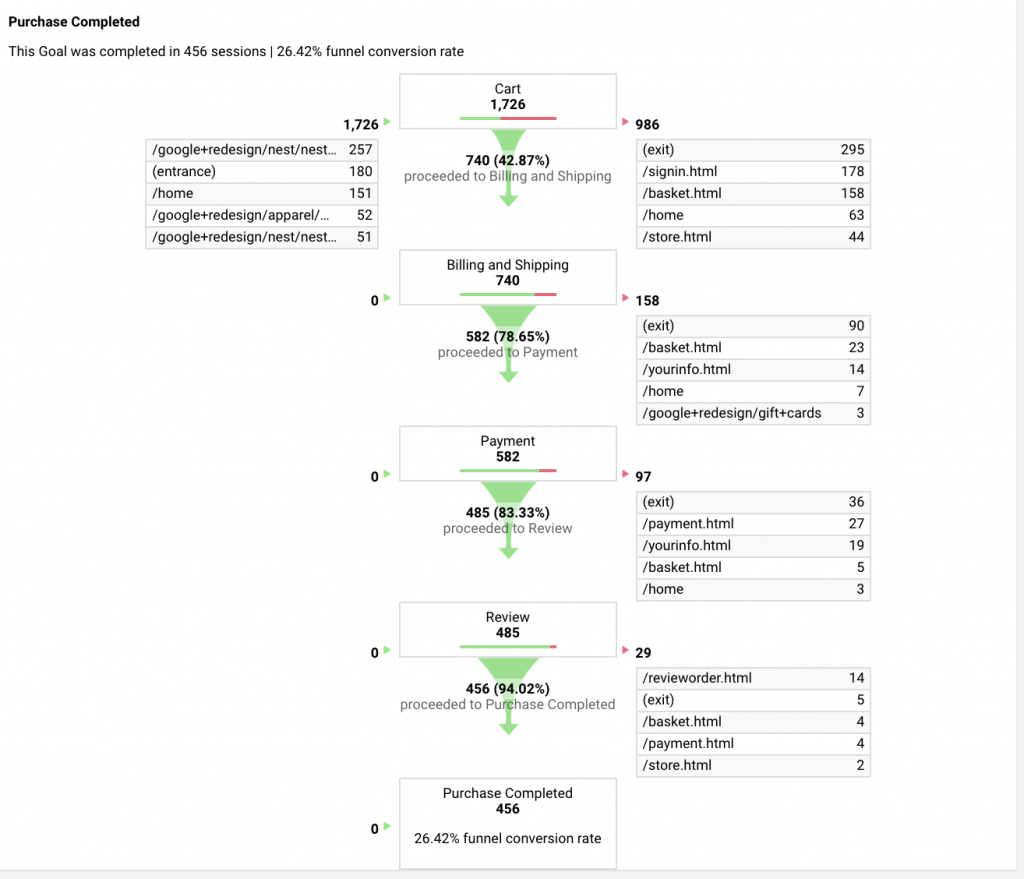
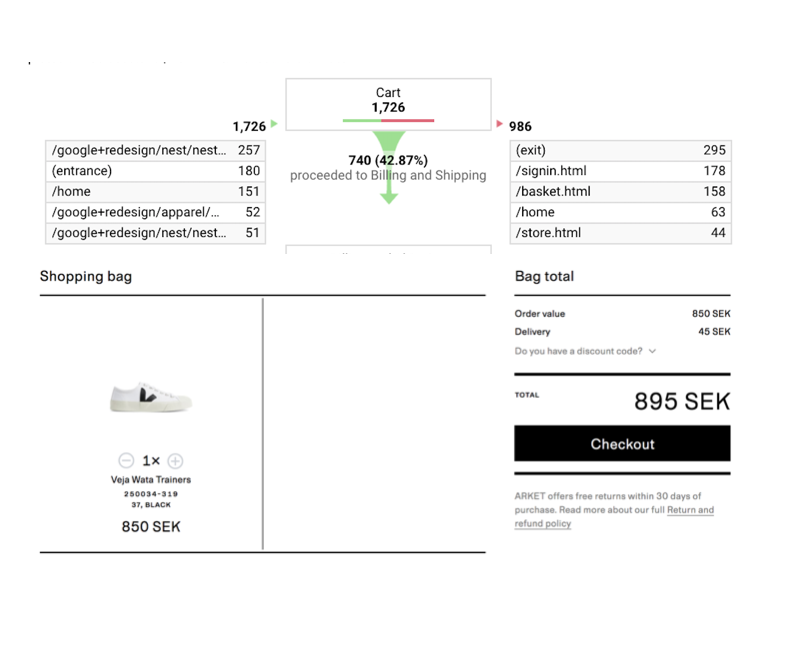
If you don’t have a funnel over the flow you wan’t to investigate you have some stuff to do. But that you have to do by yourself, because I’m not competent to teach you that, because I don’t know how to. But the funnel should be quite detailed, 21 steps is the most you can have in a funnel. So tops 21 steps I guess. But start with looking at the funnel in GA (Google analytics) and figure out which step in the funnel belongs to which step in the form (often forms in funnels). Take a screen dump on every part in the funnel and paste it in together with the part from the form it belongs to. So you have a visualisation over both the funnel and the form in the same view. And do this for every single step in the funnel. Do this in sketch, Photoshop, keynote or whatever. I usually do it in sketch.

Step number 2
Now you choose a framework for the evaluation, let’s say we use Nilsens 10 heuristics. Print them out or put them so everybody in the workshop can see them. Heres a link to another page where they recommend different UX checklist frameworks you can use.
Step number 3
Let’s kick it with the workshop. The funnel helps you to focus on the parts where you have the biggest drop off, go for those first. The funnel helps you with actual real user data. Now you can say “in this part of the form we can see a 60% drop off” you can also see where the 60% drop off goes, if they leave your product or if they go to another page on your site, and that really helps. Go through the Heuristic checklist, and sees if there could be something you could do to that part in the form based on those heuristics. For example Nilsens Heuristic number one: “visibility of system status The system should always keep users informed about what is going on, through appropriate feedback within reasonable time” and match that to the data you have in the GA funnel. I think you will have some ideas on how to make it better and reduce the drop off.
Step number 4
That idea you get from going through the heuristic and the GA funnel data should be put down as a hypothesis. They’re several different ways of writing a hypotheses, but it should look something like this.
Observation: We have observed x (based on the heuristic and the GA funnel data)
We think: by doing x (a solution based on a heuristic or just common sense)
It will help the user to: x, what value will it bring to the user, or what will it help the user to do
We will measure it by: x (this is usually the hardest part), but now you can just say, “reduced drop off in the funnel” and the funnel is already set up. You just need to make a note in GA so you know when you did the update.
Example
We think by adding a textfield explaining that the password needs to contain both letters and number.
The user will understand that he/she needs to use both number and letters in the password
We will measure it in reduced percentage of drop off in this part of the funnel
Step number 5
When you do the hypothesis, you also try to score it. You can use the ICE scoring method. You score the “idea” on the parameters of
Impact: how much impact do you think your solution is gonna have on the goal (reducing drop off)
Confidence: How confident are you that the solution is gonna have the impact you just decided. So if you say you score a 5 on the impact, then you have to score how confident you are that it will score 5.
Ease: Is how easy it is implement, you can also score it on how easy it is to measure. But do it on the “how easy it is to implement”. So you should have people as editors and developers in the workshop to get a realistic scoring. Remember that in Ease you score low if you think it’s hard and high if you think it’s easy, it can be confusing. But the hypothesis which gets the highest score is the most likely to reach the goal and it is the easiest to implement, which means it should probably be prioritised higher up than a solution which has a high score on impact but is super hard to implement.
Step number 6
You’re basically done. Collect all the hypotheses and scorings and put them in the right order. Then you have the hypothesis with the highest scoring on top and the once with the lowest in the bottom. So now you have both done a qualitative expert evaluation but based on boring quantitative user data. And we have also come up with solutions, not only find problems, which is often the case when looking at a GA funnel and doing an expert evaluation. All that in 2 hours and some time for preparation. And we have scored it all so it will be easier for the teams to plan into their backlog or your backlog.
After words
It takes some time to get into looking at GA funnels but when you get a hang on it, you want them on everything. The method is limited to the parts where you have a lot of interactions and a flow. Where you can’t have a funnel, do a lot of usability testing instead, it is always the most rewarding.
Bye bye
